Show Selection:
|
#899283 (Received by flhurricane at: 4:41 PM 23.Aug.2017)
TCDAT4
Tropical Depression Harvey Discussion Number 13
NWS National Hurricane Center Miami FL AL092017
400 PM CDT Wed Aug 23 2017
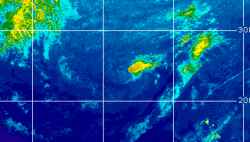
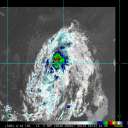
High-resolution visible satellite images show that the cloud pattern
of Harvey is a little better organized than it was this morning, but
the system lacks distinct banding features. Surface synoptic
observations, ASCAT data, and Dvorak classifications from TAFB and
SAB indicated that the cyclone has not strengthened, so the current
intensity is held at 30 kt. The global models predict that an
upper-level low over the northwest Gulf of Mexico will essentially
dissipate in a day or so. Therefore, Harvey is expected to remain
in a relatively low-shear environment up to the Texas coast.
Moreover, ocean analyses show that a warm eddy that broke off from
the Loop Current has drifted westward across the Gulf to a location
near the projected path of Harvey. This would also be conducive to
strengthening, so it is likely that the system will become a
hurricane prior to landfall, although this is not explicitly shown
in the NHC forecast for which landfall is indicated between 48 and
72 hours.
Based on the scatterometer data and geostationary satellite fixes
the center hasn't moved much this afternoon, although recent imagery
suggests a northwestward drift at about 320/2 kt. A weak mid-level
ridge to the northeast of Harvey should cause the cyclone to move
on a northwestward or north-northwestward track through 48 hours.
Later, steering currents weaken as a ridge builds over the
southwestern United States and a trough drops down from the Plains.
As a result, Harvey should decelerate while making landfall and
move very slowly just inland of the coast. Some of the track
guidance models, such as the HWRF, have shifted southwestward in
comparison to their previous run. The official track forecast is
very close to the previous one through 48 hours and is a little
slower and to the west after that time. This is very close to the
latest dynamical model consensus, TVCN. It should be noted that
synoptic surveillance data are currently being collected by the NOAA
G-IV jet aircraft and these data will be assimilated into, and
hopefully improve the forecasts by, the global models.
Key Messages:
1. Harvey is likely to bring multiple hazards, including heavy
rainfall, storm surge, and possible hurricane conditions to portions
of the Texas coast beginning on Friday.
2. Heavy rainfall is likely to spread across portions of eastern
Texas, Louisiana, and the lower Mississippi Valley from Friday
through early next week and could cause life-threatening flooding.
Please refer to products from your local National Weather Service
office and the NOAA Weather Prediction Center for more information
on the flooding hazard.
3. A Storm Surge Watch is in effect from Port Mansfield to High
Island, Texas, indicating the possibility of life-threatening
inundation from rising water moving inland from the coast during the
next 48 hours. For a depiction of areas at risk, see the Storm
Surge Watch/Warning Graphic at hurricanes.gov.
4. The Potential Storm Surge Flooding Map is available on the NHC
website. This product depicts a reasonable worst-case scenario -
the amount of inundation that has a 10 percent chance of being
exceeded at each individual location. Because the Flooding Map is
based on inputs that extend out only to about 72 hours, it best
represents the flooding potential in those locations within the
watch area.
FORECAST POSITIONS AND MAX WINDS
INIT 23/2100Z 21.6N 92.6W 30 KT 35 MPH
12H 24/0600Z 22.4N 93.0W 35 KT 40 MPH
24H 24/1800Z 23.8N 93.9W 40 KT 45 MPH
36H 25/0600Z 25.1N 95.2W 50 KT 60 MPH
48H 25/1800Z 26.4N 96.3W 60 KT 70 MPH
72H 26/1800Z 28.6N 97.3W 50 KT 60 MPH...INLAND
96H 27/1800Z 29.0N 97.3W 35 KT 40 MPH...INLAND
120H 28/1800Z 29.0N 96.5W 35 KT 40 MPH...INLAND
$$
Forecaster Pasch |


