cieldumort
Moderator

Reged:
Posts: 2520
Loc: Austin, Tx
|
|
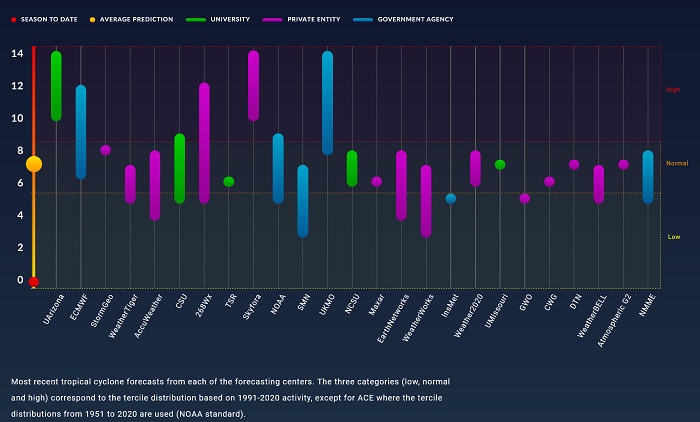
Above: Screenshot of the 2023 Season Forecasts for Hurricanes (Cats 1-5) as of 6/17/23 by various agencies compiled and tracked by SeasonalHurricanePredictions.org, a team effort from Barcelona Supercomputing Center and Colorado State University , headed by Climate Scientist Dr. Louis-Philippe Caron; Dr. Phil Klotzbach, Senior Research Scientist in the Department of Atmospheric Science at Colorado State University; Dr. Marta Terrado, Science Communicator and co-leader of the Knowledge Integration team in the Earth System Services group at BSC and Dr. Ioana Dima-West, Senior Manager – Science / Climate Change, AXA XL.
The past few years, since perhaps 2017, seasonal forecasts have arguably become more challenging for even the most seasoned seasonal forecasters, and 2023 makes the past couple of years blush.
Due to the large spread of professional preseason forecasts this year along with the unique pairing of a vigorous El Niño and record-setting Atlantic SSTs, we are kicking off this post for us as a place to discuss the updates as they come out, as well as any evolution of our own season best guesses, including updates and addendums to those of us who participated in the contest (our preseason contest numbers won't be changed, but we can post here to share any of our own updates).
This will be a good place to discuss the reasons the season totals and landfalls may or may not be changing from earlier expectations, such as the aforementioned record-warm Atlantic SSTs and El Niño.
|
cieldumort
Moderator

Reged:
Posts: 2520
Loc: Austin, Tx
|
|

Putting aside for the moment that the Cabo Verde Season has apparently decided it wants to start in June this year, rather than August or September, the latest update from the Department of Hydrologic and Atmospheric Sciences at the University of Arizona, which has one of the better seasonal forecasting track records, came out with their June update, and it's a doozy, joining the UKMO and Skyfora in calling for an extremely active 2023.
|
cieldumort
Moderator

Reged:
Posts: 2520
Loc: Austin, Tx
|
|
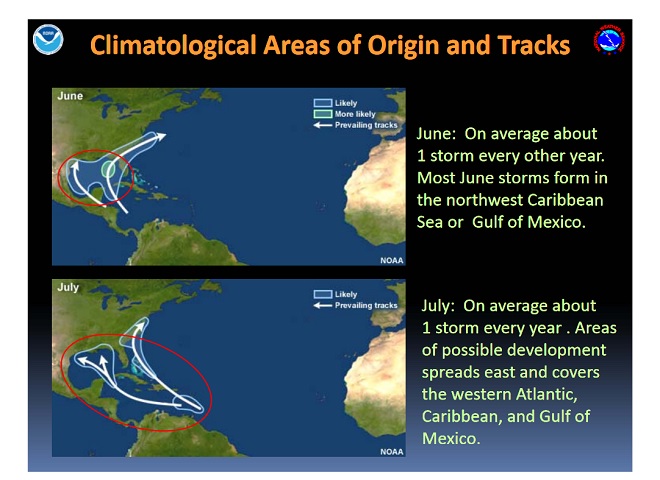
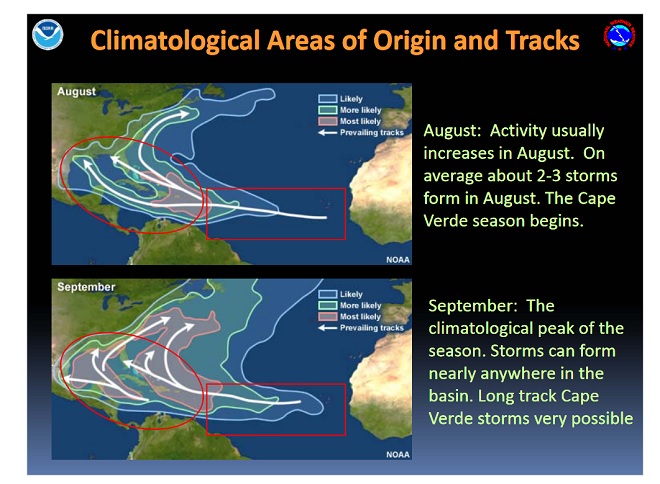
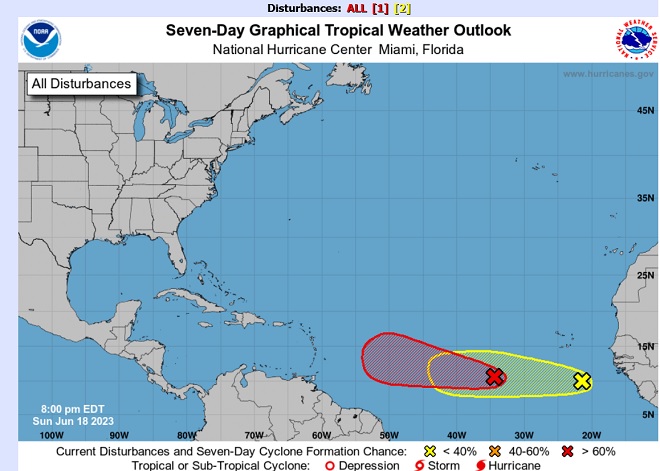
Regarding the Main Development Region (MDR) and Cabo Verde Season, as teased above, the Tropical Atlantic is ferociously active for a month of June. And this, despite the presence of an official El Niño (More about that to come).
|
cieldumort
Moderator

Reged:
Posts: 2520
Loc: Austin, Tx
|
|
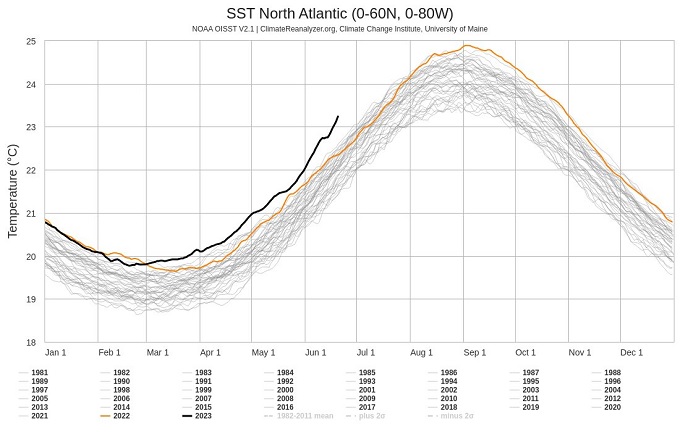
Fueling our very early and active Main Development Region activity is the anomalously warm SSTs in the North Atlantic as a whole, and in the MDR specifically.
The N ATL just set a new record anomaly on June 20th, 1.11°C above the 1991-2020 mean, +3.87 standard deviations, a 1:18,650.
Cr: Brian McNoldy
|
CFLBob
Registered User

Reged:
Posts: 7
Loc: Melbourne, FL
|
|
Is there a generally accepted explanation for the SSTs? Both this year and last seem to be on the high side of the distribution you provide.
I believe the AMO is on a downward trend now, or at least not as high as it was at the end of '22. I'm not as familiar with these cycles as I'd like to be. Since we're in a moderate El Nino, I was expecting a less active season.
CFLBob - Melbourne
--------------------
Retired engineer who still has more hobbies and interests than time.
|
cieldumort
Moderator

Reged:
Posts: 2520
Loc: Austin, Tx
|
|
AMO arguably isn't exactly on much of a downtrend (Link)
The generally accepted explanation for rising global SSTs overall is of course Anthropogenic Global Warming, but the dramatic increase seen this year in particular and last year as well may be due to greatly reduced atmospheric sulphate aerosols which could easily have been holding back AGW temperature rise for a while and is now no longer doing so " target="_blank">(Link)
|
CFLBob
Registered User

Reged:
Posts: 7
Loc: Melbourne, FL
|
|
Thanks for that. The AMO site that I used isn't as long a period as you linked, but it's very easy to see that it isn't as high as it was toward the end of '22. NOAA OOPC
What prompted me to ask was your mention of a 3.87 sigma event happening. My use of the Gaussian tables in my ex-profession (retired) left me with another implication: either it's not Gaussian or otherwise not an accurate distribution. 1 in 18,650 events are not exactly common. The fact that we have one is potentially a "head's up" that our understanding is wrong. In the electronics industry, the goal was "6 sigma quality"; anything that could be anticipated or designed for within 6 sigma of the design value was supposed to produce an acceptable product. Generally, a 4 sigma situation was a sign that the models weren't right.
The possibility that it's just showing the effects of lower SO2 emissions just raises the question of how much that could be and whether or not the magnitude is reasonable.
Sorry, just trying to learn and understand as much as possible.
--------------------
Retired engineer who still has more hobbies and interests than time.
|
CFLBob
Registered User

Reged:
Posts: 7
Loc: Melbourne, FL
|
|
Thought I'd post an update in case anyone found this interesting.
Why is it warmer than usual? A Twitter thread started by Ryan Maue says that the January '22 Hunga Tonga volcano (Hunga Tonga-Hunga Ha'apai submarine volcano) was originally estimated to have put 50 million metric tons of water into the stratosphere, but those estimates are now realized to have been low by a factor of 3x.
150 million metric tons of water, or 40 trillion gallons of water.
" target="_blank">Ryan Maue's Tweet
While Volcanic eruptions high in SO2 cause cooling, those high in water produce heating. Pinatubo's SO2 cooled the Earth for years, but Hunga Tonga had 2% of Pinatubo's SO2. They expect Hunga Tonga's water vapor to warm the Earth for seven years.
Lots more detail at EOS.
Originally found at:
https://wattsupwiththat.com/2023/07/23/ryan-maue-on-hunga-tonga-hunga-haapai-submarine-volcano
Edited by CFLBob (Wed Jul 26 2023 01:37 PM)
|


 Threaded


