Lysis
User

Reged:
Posts: 451
Loc: Hong Kong
|
|
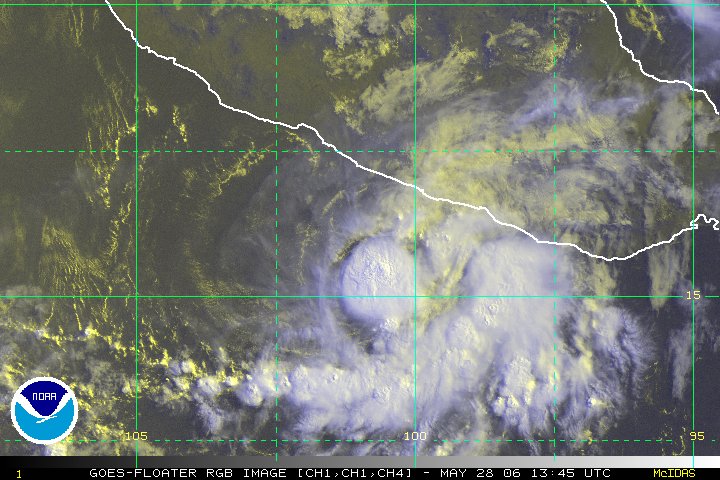
No dude, that is an Infrared loop. No eye... quite the contrary infact. The reds and darker colors signify intense convection, and perhaps, as Rich B said, the cyclone is attempting to form a .
Look at the overshooting cloud top in the visible loop. That is what you are seeing:
http://www.ssd.noaa.gov/GOES/FLT/T1/RGB_loop.html
EDIT: Uh, yeah... that is why they have names that span over multiple demographics. The US isn't the only place hit by hurricanes, you know. 
EDIT II: ah... sorry daniel. Perhaps I used the wrong terminology. Not as in a severe thunderstorm. You are right.
--------------------
cheers
Edited by Lysis (Mon Aug 22 2005 08:00 PM)
|
danielw
Moderator

Reged:
Posts: 3526
Loc: Hattiesburg,MS (31.3N 89.3W)
|
|
Quote:
Look at the overshooting cloud top in the visible loop. That is what you are seeing:
I'm not seeing any overshooting cloud tops. You may be seeing a shadow of a higher cloud that is moving with the Sun at a low angle. It looks clear and smooth over Jose'.
That's an RGB Loop. Not a true visible light spectrum. (man made)
|
Jekyhe904
Verified CFHC User
Reged:
Posts: 22
Loc: Jacksonville, Florida
|
|
If the 18Z is correct, I found 4 landfall points for xtd10. cuba, Keywest, Pensacola, and New orleans as it makes the final landfall in about 336 hours. Would love to see a model track of this loop 
http://www.nco.ncep.noaa.gov/pmb/nwprod/analysis/
Edited by danielw (Mon Aug 22 2005 11:26 PM)
|
NONAME
Weather Guru
Reged:
Posts: 136
|
|
What is happen with R10 and when is recon going to be in Jose again before landfall
--------------------
I am a young Weather enthusiast and really want to get to college in a couple of years for meteorology.
|
danielw
Moderator
Reged:
Posts: 3526
Loc: Hattiesburg,MS (31.3N 89.3W)
|
|
Jose', should be making landfall in the next 6 hours or so...being he's only about 40 miles from the beach as it is.
The link above, referring to XTD 10 is a Surface based, precip loop and Does Not imply anything other than rain, thunderstorms, and a surface pressure of around 1008mb.
The vorticity structure of XTD 10 remains aloft, to some degree. As evidenced in the 850 and 500mb level plots.
**I will go along with you on the connection between the Turks/ Caicos vortice and the GOM vortice. I'll have to look at the run to run continuity. Although there is a break in the signature...it remains in the general vicinity.
|
MikeG
Unregistered
|
|
ahhhh......another pretty picture of a tropical system this yeah
JOSE i can see ya
before sun goes down!
|
MikeG
Unregistered
|
|
so what does everybody think about the feature around 70w 25n will do to wave to it's south....
is it that a mid to upper level low moving nw to west?
|
Keith234
Storm Chaser

Reged:
Posts: 921
Loc: 40.7N/73.3W Long Island
|
|
Quote:
Quote:
Look at the overshooting cloud top in the visible loop. That is what you are seeing:
I'm not seeing any overshooting cloud tops. You may be seeing a shadow of a higher cloud that is moving with the Sun at a low angle. It looks clear and smooth over Jose'.
That's an RGB Loop. Not a true visible light spectrum. (man made)
I believe this is what Lysis was referring to.
http://hadar.cira.colostate.edu/ramsdis/online/trop_ge_storm_relative_0.html
if you look dead in the center you can see that there is an overshooting cloud top. Makes it look very symmetric.
Edited by danielw (Mon Aug 22 2005 09:18 PM)
|
danielw
Moderator
Reged:
Posts: 3526
Loc: Hattiesburg,MS (31.3N 89.3W)
|
|
MODEL DIAGNOSTIC DISCUSSION
NWS HYDROMETEOROLOGICAL PREDICTION CENTER CAMP SPRINGS MD
122 PM EDT MON AUG 22 2005 ([]edited~danielw)
VALID AUG 22/1200 UTC THRU AUG 26/0000 UTC
......FEATURE IN VICINITY OF THE BAHAMAS...
THE 12Z HAS CONTINUED THE IDEA OF DEVELOPING THE AREA OF
DISTURBED WX INVOF THE SERN BAHAMAS. THE INITIAL DEVELOPMENT IS
SUGGESTED BEFORE THE END OF DAY 1...BUT MORE SIGNIFICANT DEEPENING
IS SUGGESTED ESP AFTER 48 HRS. THE TAKES A SFC LOW TRACK NWWD
THRU THE CTRL BAHAMAS AND INTO THE NWRN BAHAMAS. THIS TRACK IS
JUST TO THE LEFT OF THE PREVIOUS TRACK AND IS PERHAPS JUST A
LITTLE SLOWER.
THE 12Z ALSO CONTINUES TO SHOW DEVELOPMENT...BUT HAS TRENDED
WEAKER WITH IT FOR THE FIRST 36 HRS. THEREAFTER...THE 12Z RUN IS
BASICALLY IN LINE WITH THE 00Z RUN REGARDING THE DEVELOPMENT. ITS
TRACK HAS ALSO SHIFTED SLIGHTLY TO THE LEFT ALL THE WAY THRU 84
HRS.
http://www.hpc.ncep.noaa.gov/discussions/pmdhmd.html
|
Ron Basso
Storm Tracker

Reged:
Posts: 267
Loc: hernando beach, FL
|
|
Interesting twist to the 18Z and 12Z models in that both now take a developing low pressure across S FL into the SE GOM and then slowly move the system north along the west coast of FL. Yikes!
http://bricker.met.psu.edu/~arnottj/cgi-...;hour=Animation
http://www.ecmwf.int/products/forecasts/...s!2005082212!!/
--------------------
RJB
|
Big Red Machine
Storm Tracker
Reged:
Posts: 223
Loc: Polk City, FL
|
|
Very interesting runs there Ron. Also important I think is the fact the kind of stalls it out along the west coast, as from 96-144 hrs, movement is very slow.
Accoding to Accuweather tonight, the weaker the high, the worse it is for Florida. Despite the need for rain in some areas of the state, a slow crisscrosser regardless of intensity (TD/TS/H) would not be a good thing. The latest model runs (BAMMs, LBAR, etc) did shift a little more north than they had been previously. Obviously we need a true LLC before the models can spit out truly accurate info, but those runs were eye catching.
Edited to add another model showing the "end around" of Florida: Model
Edited again so that it does not screw up the page. sorry about that.
Edited by Big Red Machine (Mon Aug 22 2005 11:24 PM)
|
La Nimo
Weather Watcher
Reged:
Posts: 42
Loc: st. pete beach
|
|
Be carefully for what you wish for,you been wishing for it all week, well you may get it in your backyard.
someone was wishing for something? who was that, may i ask?
Edited by HanKFranK (Mon Aug 22 2005 10:18 PM)
|
SkeetoBite
Master of Maps

Reged:
Posts: 298
Loc: Lakeland, FL
|
|
This map includes the last Discussion track data and position FROM 8/14/2005.

000
WHXX01 KWBC 230116
CHGHUR
DISCLAIMER...NUMERICAL MODELS ARE SUBJECT TO LARGE ERRORS.
PLEASE REFER TO TPC/NHC OFFICIAL FORECASTS FOR TROPICAL CYCLONES.
National Hurricane Center NORTH ATLANTIC OBJECTIVE AIDS FOR
TROPICAL DEPRESSION TEN (AL102005) ON 20050823 0000 UTC
...00 HRS... ...12 HRS... ...24 HRS... ...36 HRS...
050823 0000 050823 1200 050824 0000 050824 1200
LAT LON LAT LON LAT LON LAT LON
BAMD 21.3N 73.5W 21.8N 75.1W 22.4N 76.8W 23.0N 78.7W
BAMM 21.3N 73.5W 21.9N 75.2W 22.6N 76.9W 23.2N 78.6W
A98E 21.3N 73.5W 21.7N 74.7W 22.3N 76.1W 23.3N 77.9W
LBAR 21.3N 73.5W 21.9N 75.1W 23.1N 76.8W 24.5N 78.6W
SHIP 20KTS 24KTS 31KTS 39KTS
DSHP 20KTS 24KTS 31KTS 39KTS
...48 HRS... ...72 HRS... ...96 HRS... ..120 HRS...
050825 0000 050826 0000 050827 0000 050828 0000
LAT LON LAT LON LAT LON LAT LON
BAMD 23.6N 80.7W 24.3N 84.1W 24.1N 87.2W 23.7N 89.9W
BAMM 23.9N 80.3W 24.5N 83.1W 24.2N 85.5W 23.8N 87.6W
A98E 24.5N 80.2W 25.3N 85.8W 25.4N 90.0W 23.6N 91.5W
LBAR 25.9N 80.0W 27.5N 80.8W 28.8N 79.6W 30.7N 79.6W
SHIP 49KTS 63KTS 73KTS 78KTS
DSHP 49KTS 63KTS 73KTS 78KTS
...INITIAL CONDITIONS...
LATCUR = 21.3N LONCUR = 73.5W DIRCUR = 285DEG SPDCUR = 6KT
LATM12 = 20.9N LONM12 = 72.3W DIRM12 = 283DEG SPDM12 = 7KT
LATM24 = 20.7N LONM24 = 70.8W
WNDCUR = 20KT RMAXWD = 25NM WNDM12 = 20KT
CENPRS = 1012MB OUTPRS = 1014MB OUTRAD = 125NM SDEPTH = M
RD34NE = 0NM RD34SE = 0NM RD34SW = 0NM RD34NW = 0NM
|
Old Sailor
Storm Tracker

Reged:
Posts: 293
Loc: Florida
|
|
Your plots looks up to date but the run model calc. is 6 hours old am I wrong here?
Dave
|
danielw
Moderator
Reged:
Posts: 3526
Loc: Hattiesburg,MS (31.3N 89.3W)
|
|
Once again, Skeet comes through!
I've noticed that most of the model animations that are being posted use the surface level pressures.
While these are fine in determining surface pressure and precipitation.
The Upper Air level animations should give a better idea of the vorticity, or spin, of the systems.
Try looking at the 850mb and 500mb level animations.
A tropical wave or depression would be visible in the 850mb levels.
Whereas a Cat 1 hurricane should extend into the 500mb levels and possibly into the 250mb level.
It will give you a better idea of the depth of the storm. 3-D if you will.
|
WXMAN RICHIE
Weather Master

Reged:
Posts: 463
Loc: Boynton Beach, FL
|
|
Here is tonight's take on the situation from a local WPB meteorologist who has been advertising for days a possible flooding situation approaching Florida at a snails pace:
Rich, that is a very good analogy of Jerry.....Although the upper atmospheric conditions are not what I call the best for this situation..The one thing I looked at is the steering winds up to mid levels which reveal to me that this system will be slow to move and given the fact that with the sun's unusually high solar radiation and little in the way of rain the water temps jumped up quite a bit. This may have been the contributing factors for Jerry in 1995 but in this case though this tropical wave heading our way is actually going to move just south and we are in the wettest part of it..a 1008 mb tropical low by late friday night on the is no joke to me..in fact a slow movement in the area of our adjacent atlantic and more specifcally the keys and the gulf is really a concern ...a 1008mb low to me already means a tropical depression...even if it moves slowly westward across the keys Friday and slowly turns northwest actually going around the entire offshore peninsula from the southeast coast to the west coast of florida...into the weekend...this is really a system to watch out for a deluge of a rainmaker!
--------------------
Another typical August:
Hurricane activity is increasing and the Red Sox are choking.
Live weather from my backyard:
http://www.wunderground.com/weatherstation/WXDailyHistory.asp?ID=KFLBOYNT4
|
MikeG
Unregistered
|
|
TAFB outlook
http://www.nhc.noaa.gov/tafb_latest/danger_atl_latestBW.gif
YEP.....August could go out with a bang!
|
SkeetoBite
Master of Maps
Reged:
Posts: 298
Loc: Lakeland, FL
|
|
Quote:
Your plots looks up to date but the run model calc. is 6 hours old am I wrong here?
Dave
The data is the old data from 8/14 - the last discussion they released on this storm. We are working on an issue with the UKMET models, which do not show up in our system if the UK Mets don't include the identifier in their data, in this case, AL102005.
edited to add...
The UKMET models should magically appear in the right location once this issue is resolved. The thumbnail above and the iimage it links to updatd automatically as model data is added to our system.
|
Old Sailor
Storm Tracker
Reged:
Posts: 293
Loc: Florida
|
|
What I was saying the run from today but for 20050822 1800 UTC not 20050823 0000 UTC which is what your plot shows, no big deal .
Dave
|
SkeetoBite
Master of Maps
Reged:
Posts: 298
Loc: Lakeland, FL
|
|
Quote:
What I was saying the run from today but for 20050822 1800 UTC not 20050823 0000 UTC which is what your plot shows, no big deal .
Dave
OH!!! LOL! The thumbnail updated with the latest data before I posted. I went back and grabbed the updated text.
Good catch, thanks.
|


 Threaded


