Ed in Va
Weather Master
Reged:
Posts: 489
Loc:
|
|
Seems like this has been answered before, but I don't remember the response. If I look at the 18Z
GFDL runs for Danielle and Earl, I see radically differerent solutions for the storm not highlighted. Example, the Danielle run has D hooking toward the VA_NC coast, but the Earl run shows D recurving.??
(Excellent question - and I've moved it here (a better place for it) so that the answer can be available for future reference.)
Edited by Ed Dunham (Wed Aug 25 2010 11:58 PM)
|
LoisCane
Veteran Storm Chaser

Reged:
Posts: 1237
Loc: South Florida
|
|
Interesting observation. I've wondered that a few times. When I see it I figure something is off in that model and tend to discount it. But, it happens often when there are different models. Would like a better answer though.
--------------------
http://hurricaneharbor.blogspot.com/
|
metwannabe
Weather Hobbyist

Reged:
Posts: 92
Loc: NC
|
|
It is an interesting observation, I notice too that when I run it for Danielle, Earl not only recurves it never really develops, yet when I run it for Earl it is a formidable hurricane. I really have no clue but I am assuming the individual runs are fed the individual storms information, just my educated guess. One things for sure if the is anywhere close to right Earl will need to be watched!
--------------------
Fran, Bertha, Dennis & Floyd (Tag Team)
|
LoisCane
Veteran Storm Chaser

Reged:
Posts: 1237
Loc: South Florida
|
|
so so true...
maybe someone will explain
imagine its a matter of focusing on one set of data from one storm but shouldn't they both overlay each other in some fluid fashion?
http://moe.met.fsu.edu/cgi-bin/gfdltc2.c...;hour=Animation
--------------------
http://hurricaneharbor.blogspot.com/
|
Ed Dunham
Former Meteorologist & CFHC Forum Moderator (Ed Passed Away on May 14, 2017)
Reged:
Posts: 2565
Loc: Melbourne, FL
|
|
The very short answer is that the is a Regional model that operates in a tightly confined box around the tropical cyclone, whereas the is a global model that supplies the 'boundary' conditions for the run in a much lower data resolution.
For those of you that would like a little more detail, here is the technical explanation from :
"2. Regional TC Dynamical Models
Regional TC dynamical models are dynamical models with domains that encompass the area of influence of a TC while obtaining their boundary conditions from a global dynamical model. Table 3 provides details on the operational characteristics and resolution of the nested TC dynamical models primarily used at .
Table 3. Description of the most commonly used nested TC dynamical models at .
Nested TC Dynamical Model Global Model Boundary Conditions Horizontal Grid Spacing Vertical Levels Coupled Ocean Model(s)
GFDL1 GFS 75° x 75° Outer grid ~30 km
11° x 11° Middle grid ~10 km
5° x 5° Inner grid ~5km 42 Atlantic: 3-D POM
Pacific: 1-D POM
GFDN2 NOGAPS 75° x 75° Outer grid ~30 km
11° x 11° Middle grid ~10 km
5° x 5° Inner grid ~5km 42 Atlantic: 3-D POM
Pacific: 3-D POM
HWRF3,4 GFS 75° x 75° Outer grid ~27 km
Inner grid ~ 9km 42 Atlantic: 3-D POM
Pacific: None
NWS Geophysical Fluid Dynamics Model (GFDL) Hurricane Model
The Hurricane Model is a limited-area, triply-nested grid-point model designed specifically for TC prediction. This grid configuration along with other technical specification for the can be found in Table 3. The is run for up to four TCs every six hours out to 126 hours as requested by and CPHC. The high resolution of the allows it to resolve relatively small-scale features within a TC such as the eye and eyewall. Still, even the is not able to fully resolve the highly complex structure of a TC. The is coupled with a high-resolution version of the Princeton Ocean Model (POM), which allows TC-induced ocean modification, such as sea-surface temperature cooling, and partially accounts for the feedback of the modified ocean on the TC. In the Atlantic, the POM is three dimensional with 23 vertical levels. In the eastern North Pacific where ocean currents and sea surface temperature gradients are more predictable, only a one-dimensional POM is used. In the analysis, the TC vortex is replaced with an axisymmetric vortex spun up in a separate model simulation. The axisymmetric vortex model utilizes TC specifications as provided by forecasters.
Since the horizontal resolution of the is sufficiently high to represent some of the inner core TC structure, the model has up to now been the only purely dynamical model that can provide both skillful intensity and track forecasts (http://www.nhc.noaa.gov/verification/verify3.shtml).
While it is still used operationally, there are no plans to further develop the Hurricane Model. However, the GFDN model, which currently has resolution and physics similar to the , will continue to be improved."
Its important to note that there are three 'nested' grids. The outer grid with data at 30KM resolution, the middle grid with 10KM resolution and an inner grid with 5KM resolution.
Cheers,
ED
|
berrywr
Weather Analyst

Reged:
Posts: 387
Loc: Opelika, AL
|
|
Okay...let me take a crack at this...the only models y'all need to pay attention to are the , , and the HWRO; three of them can be found at the Models and Forecast Branch over at NCO 's website and I doubt you're going to find another website with the resolution they provide. I use San Diego State University's Weather Lab which overlays the and on one chart.
The is also found on the NCO website and has been around as far back as my active duty in the Air Force but under a different name and is also reliable; however like all models each because of what Ed just wrote about use different formulas and continue to be tweaked to this day.
This year, the has had a bias for depicting systems in the low latitudes as being stronger than other models depict them to be. The and have been neck and neck this year and have performed exceptional over the Atlantic despite no upper air data.
As a matter of preference I analyze the 00Z and 12Z packages because those charts have been updated to include new upper air observations that launch at those times across the world.
I can't speak for Ed but you may have noticed we don't get caught up in every little detail of each of these charts; what we're looking for is continuity. We locate where everything and like many of the discussions we're looking for changes and what chart is performing the best. We look at everything from satellite imagery, streamlines, shear analysis and depending on where we make our comments depends on what forum we're in.
Each of you love weather or y'all wouldn't be here. It's my job to try and articulate to the best of my ability what it is y'all are looking at, talking about and provide assistance. We certainly don't want to talk over your heads.
I do stress this caution....and Ed's dead on about this....the model outputs are for the most part very good out to 120 hours. There are some scenarios we can go out further and others as few as 48 hours and sometimes even less.
Tonight, Hurricane Danielle is pretty straightforward however at the end of the period the models do not agree on where everything should be and I cannot stress enough how important these little differences are; particularly for Bermuda and the NE United States. I can tell you we think Danielle will re-curve and we were pretty confident about that two days agao. We're not quite there tonight because the data we all look at isn't clear cut nor in agreement with each other.
Tropical Storm Earl while it appears it's making a carbon copy trace of Danielle will likely stay on a more southerly track and we don't know where recurvature is likely to be at this time. We think it will and get hung out to dry south of Bermuda and well offshore NC/SC.
I will do my best to answer all of your questions, but for the next few days; maybe at least five days, there's not much we're going to know on Earl until the storm is where Danielle is now.
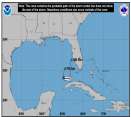
Finally, we don't know if a model depicts a low that be default makes it a tropical cyclone. What our eyes see does not imply it is what we initially think or want it to be. I reference the and the Gulf of Mexico these past couple of days. At first glance, you'd swear there's something to it, but without everything else we simply can't jump on the band wagon and say; that's a tropical cyclone and hit the panic button.
There will be data and models each of you are going to look at that we may dismiss and I promise y'all it isn't deliberate.
Tonight...both the and are doing exceptionally well with Danielle and we have reason to believe they are the models of choice for Earl in the days ahead. These models are the big boys...their global models. The as Ed so eloquently stated is on a smaller scale and really zeroes in on that storm's environmental envelope.
We use everything in concert with each other. We also rely on y'all to help us zero in on what each of you are looking at; thus saving us time to analyze and get back with each and all of you.
Have a good day/evening...
Bill
--------------------
Sincerely,
Bill Berry
"Survived Trigonometry and Calculus I"
|
berrywr
Weather Analyst

Reged:
Posts: 387
Loc: Opelika, AL
|
|
Quote:
It is an interesting observation, I notice too that when I run it for Danielle, Earl not only recurves it never really develops, yet when I run it for Earl it is a formidable hurricane. I really have no clue but I am assuming the individual runs are fed the individual storms information, just my educated guess. One things for sure if the is anywhere close to right Earl will need to be watched!
"Earl" will be with us for at least 7 more days; "Danielle" is within reliable model output range where Earl is not. Y'all are looking at data that I wouldn't dare comment on without context. We simply don't know.
--------------------
Sincerely,
Bill Berry
"Survived Trigonometry and Calculus I"
|
cjzydeco
Weather Guru

Reged:
Posts: 120
Loc: Sebastian, FL
|
|
Thanks, Bill. A lot of these are things many of us have read in the past, but I know I'm always rusty with the first two or tree storms each hurricane season.
Is this the link you use at for the forecast models?
http://www.nco.ncep.noaa.gov/pmb/nwprod/analysis/
And do you have a link for San Diego State University's Weather Lab?
--------------------
Frances '04, Jeanne '04, Wilma '05, Ernesto '06, Faye '08, Hermine '16, Irma '17, Michael '18, Idalia '23, Helene '24
|
metwannabe
Weather Hobbyist

Reged:
Posts: 92
Loc: NC
|
|
I was really only commenting on Ed in Va's comment about when you run the for Danielle you see Eart doing one thing, but when you run it for Earl you see another and vice versa (which Ed thoroughly answered, thanks Ed).....there was no real discussion about long range track/intensities, etc although I believe this would be the lounge to do just that if someone so desired.
--------------------
Fran, Bertha, Dennis & Floyd (Tag Team)
|


 Threaded


