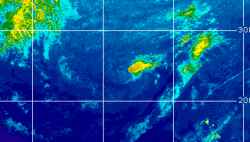
Current Radar or Satellite Image

Flhurricane.com - Central Florida Hurricane Center - Tracking Storms since 1995Hurricanes Without the Hype! Since 1995


The Atlantic is quiet
Days since last H. Landfall - US: Any 45 (Milton) , Major: 45 (Milton) Florida - Any: 45 (Milton) Major: 45 (Milton)


General Discussion >> Hurricane History

Pages: 1
Francesco
Registered User


Reged:
Posts: 1
Wilma (2005) 882mbar
      #89297 - Wed Sep 01 2010 12:40 AM Attachment (400 downloads)

Dear All,

I am new here - have a quick question. From what I've read - the NHC recorded Wilma's pressure as 884mbar at 0800 UTC 19 Oct. 2005. Since the dropsonde did not reach the center, pressure was estimated to be 882mbar. Later at 1200 UTC pressure was recorded as 882mbar, and as late as 1500 UTC Wilma was still estimated to have a central pressure of 882mbar. By 2100 UTC central pressure had risen to 892mbar.

The question: for how many hours did Wilma sustain (882mbar) pressure, and at what time (approx.) did central pressure begin to rise?

I attached a satellite image taken at 1615 UTC 19 Oct. Was central pressure still estimated to be 882mbar at this time?

I apologize if this question seems out of place.

-Francesco

Edited by Francesco (Wed Sep 01 2010 12:46 AM)


Post Extras: Print Post   Remind Me!   Notify Moderator  
Ed DunhamAdministrator
Former Meteorologist & CFHC Forum Moderator (Ed Passed Away on May 14, 2017)


Reged:
Posts: 2565
Loc: Melbourne, FL
Re: Wilma (2005) 882mbar [Re: Francesco]
      #89299 - Wed Sep 01 2010 02:17 AM

No, its a good set of questions and this Forum is okay for it since it deals with a very historic hurricane. First, here is an extract from the NHC bulletins:

"14 16.80 -82.10 10/19/03Z 95 945 HURRICANE-2
15 16.90 -82.00 10/19/05Z 130 901 HURRICANE-4
15A 17.00 -82.20 10/19/06Z 130 901 HURRICANE-4
16 17.20 -82.50 10/19/09Z 150 884 HURRICANE-5
16A 17.20 -82.80 10/19/12Z 150 882 HURRICANE-5
17 17.40 -83.20 10/19/15Z 150 882 HURRICANE-5
17A 17.50 -83.50 10/19/18Z 145 900 HURRICANE-5
18 17.70 -83.70 10/19/21Z 140 892 HURRICANE-5
18A 17.90 -83.90 10/20/00Z 140 892 HURRICANE-5
19 18.10 -84.30 10/20/03Z 135 894 HURRICANE-4
19A 18.10 -84.70 10/20/06Z 135 899 HURRICANE-4
20 18.30 -85.00 10/20/09Z 130 900 HURRICANE-4
20A 18.30 -85.20 10/20/12Z 125 910 HURRICANE-4"

At 0800Z, recon reported a central pressure of 884MB - and this was the value that was used in the bulletin at 09Z. When the aircraft landed the calibrated value was confirmed to be 882MB and this value was used in the bulletins at 12Z and 15Z. At 18Z, the NHC bulletin estimated pressure at 900MB and at 1806Z, recon reported a value of 894MB, so it is quite likely that almost immediately after 15Z the pressure began to rise. The period of record for 882MB is 08Z to 15Z - a total of 7 hours, but at 1615Z the pressure would have already been on the increase. Notice the pressure drop of 44MB in two hours from 03Z to 05Z - quite remarkable!
ED


Post Extras: Print Post   Remind Me!   Notify Moderator  
Pages: 1


Extra information
0 registered and 7 anonymous users are browsing this forum.

Moderator:  

Print Topic

Forum Permissions
      You cannot start new topics
      You cannot reply to topics
      HTML is disabled
      UBBCode is enabled

Rating:
Topic views: 4976

Rate this topic

Jump to

Note: This is NOT an official page. It is run by weather hobbyists and should not be used as a replacement for official sources. 
CFHC's main servers are currently located at
Hostdime.com in Orlando, FL.
Image Server Network thanks to Mike Potts and Amazon Web Services. If you have static file hosting space that allows dns aliasing contact us to help out! Some Maps Provided by:
Great thanks to all who donated and everyone who uses the site as well. Site designed for 800x600+ resolution
When in doubt, take the word of the National Hurricane Center