
Latest CFHC News
- See More News...
Ending July with the Atlantic Quieter, Pacific Roaring
Posted: 02:43 PM 26 July 2026 | | Add Comment
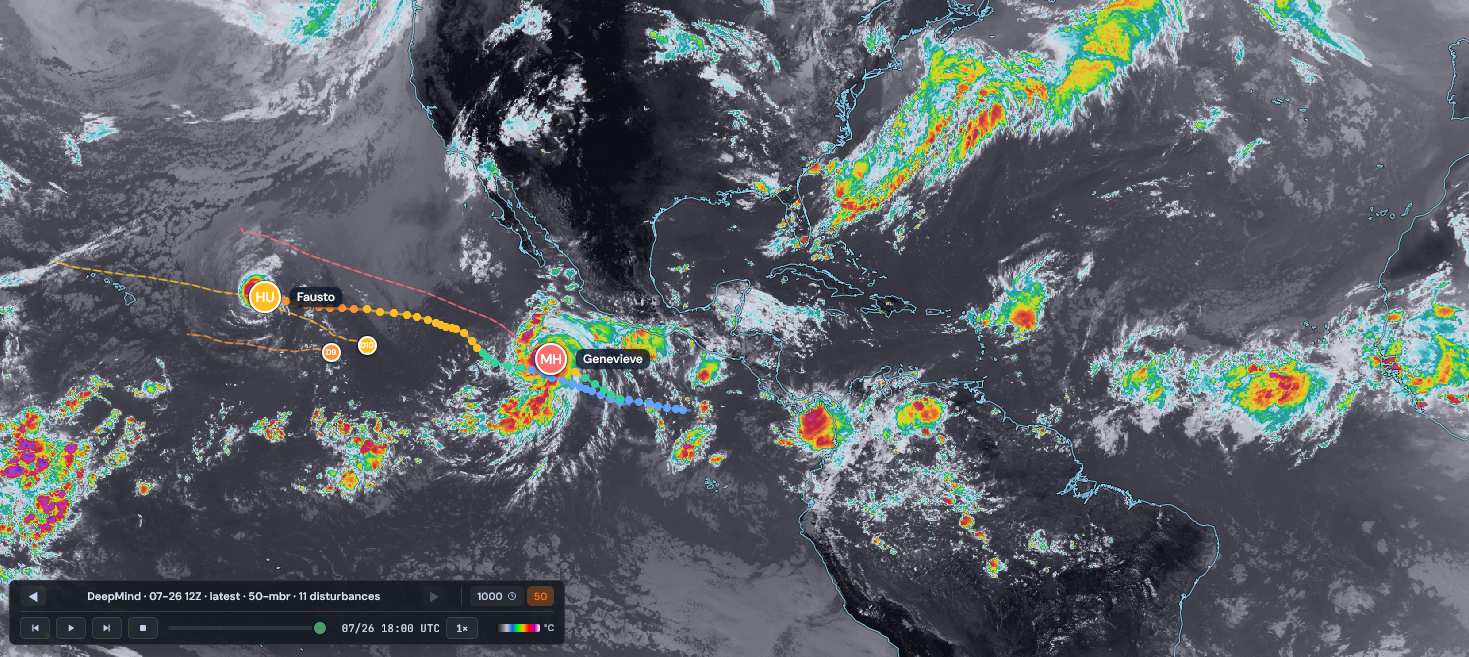
Screenshot image credit: TC-ATLAS
What is becoming quite possibly one of the strongest, if not the strongest, El Niños on record, has made it very difficult for otherwise could-be very powerful tropical cyclones in the Atlantic to level up. Both Arthur and Bertha had internal dynamics that in even just average ENSO years could easily have had them both become formidable early season hurricanes, came in much less intense versions of themselves. In the Pacific, things are completely different, and a number of US land locations on that side of the CONUS look to be at greater risk for impacts and maybe even direct hits this year.
We are currently tracking Hurricane Fausto, which is likely to at least indirectly swipe the northern Hawaiian islands and bring enhanced, potentially flooding rainfalls to some locations there. We have a Lounge up on this system and have allowed our Hype Scale to reflect the possibility of a US land impact for it, although this number could be coming down if current north-side-of-cone tracks continue. Recon is flying multiple flights into Fausto and this information is truly helping to improve the forecast.
Getting back to the Atlantic as we head into August, even strong El Niño years can occasionally see substantial rampups during that roughly August 20 to Sep 10 lead into climatological peak, so things may pick up later in August. Near-term, both the MJO and NAO phases are actually supportive for development in the Atlantic basin, but Chris Farley would like to have a word with them.
Latest Meteorologist Blog - See Less Blogs...
Ed Dunham
Hurricane Matthew Weather Summary for East Central Florida
Posted: 05:32 PM 16 October 2016
Hurricane Matthew passed just offshore of east-central Florida on the morning of October 7, 2016, as a Category III Major Hurricane with sustained winds of 115mph. The diameter of the eye at 5AM on Friday, October 7th, was 35NM and its location was 28.2N 80.0W or about 36 miles east of Patrick AFB with a movement to the north northwest at 13mph. Matthew moved parallel to the Florida coastline from Fort Pierce to Saint Augustine and then northward thereafter toward the South Carolina coast. Matthew never made landfall in Florida - the closest approach was at 6AM when the western edge of the eyewall brushed Cape Canaveral. Although the Tropical Storm force windfield was large, sustained winds of Hurricane strength only extended 40NM from the center on the western side of the tropical cyclone. Sustained hurricane force winds on land were confined to a small area at South Patrick Shores on the Barrier Island and a small area on the eastern tip of Cape Canaveral. In all other east central Florida coastal locations sustained winds of strong tropical storm force were observed. Storm total rainfall was generally in the 3 to 5 inch range except that some areas in Sanford received up to 9 inches of rain. Storm surge was in the 3 to 5 foot range along the east central Florida coast. During the storm, weather observations were not available from Indialantic, Patrick AFB, Cape Canaveral AFS and Titusville Airport - leaving a critical void in the meteorological record.
A low pressure reading of 28.97" was recorded at Melbourne NWS at 7AM. At 7:30AM I noted a pressure reading of 28.98" at my home in northwest Melbourne. The lowest pressure was located in the southern section of the eye of the hurricane and the central pressure from the Hurricane Hunters was recorded at 938MB (27.90") at 1AM. At 4AM the aircraft reported a circular eye with a diameter of 32NM and a central pressure of 942MB with flight level wind at 118 knots which translates to a 100 knot surface wind (115mph). At 7:17AM the aircraft sent a position fix for the eye at 28.6N 80.2W with a pressure of 942MB and eyewall sustained surface winds of 110 knots. The eye of Matthew had contracted to a circular 20NM diameter as the hurricane passed to the east of the area. Although the radius of the eye had contracted from 17NM to 10NM, the radius of sustained hurricane force winds remained at 40 miles to the west of the center. The central pressure increased and leveled off at 947MB during the day on Friday as Matthew moved NNW. If the eye of Matthew had moved along the shoreline, i.e., if it had been 35-40 miles further to the west, damage would have certainly been greater but no realistic conclusion can be made with regard to the extent of the destruction because an on-shore system would have slowly weakened.
Matthew goes into the record books as a Category I Hurricane in a small section of the Brevard County coast. In some reports from the NHC the flight level Recon wind speeds were not reduced correctly and resulted in stated maximum eyewall surface wind speeds that were about 10mph too high - and I cannot find a valid meteorological reason for doing this. Hurricane Erin in 1995 and Hurricanes Frances and Jeanne in 2004 were all storms with a greater impact on Brevard County. While the early call by the Brevard Emergency Management Operations Center to evacuate residents from the Barrier Islands was prudent, the overstated intensity and inland impacts were mis-leading and confusing to some of our residents. The National Hurricane Center and The Weather Channel both over-hyped the overall magnitude of the storm - which will not help folks to make the correct decision when the next hurricane visits our area. Matthew was not the catastrophic Category IV storm of the century that was touted by some for our area. All hurricanes are dangerous and deserve proper preparation and decision-making. It is worth noting that the area from Melbourne Beach to Titusville has never recorded a Cat III or greater hurricane. Someday that record of 165 years will probably be broken, but Matthew was not that storm. Hurricane David, September 3-4, 1979, was the last Category II Hurricane to hit this area with eye passage along the coast from West Palm Beach to New Smyrna Beach.
ED
Selected Weather Reports:
Vero Beach - wind W 49G74mph Rainfall 3.16"
Sebastian - wind N 30G59mph
5N Barefoot Bay - wind N G74mph
4NNW Grant - wind NW 51G68mph
Malabar - wind N 60G72mph
Melbourne Beach - wind N 23G63mph Lowest SLP: 28.85"
Melbourne (Dairy Road) - wind N 44G71mph
Melbourne - wind N 44G76mph Lowest SLP: 28.97"
NW Melbourne - wind NNW 42G65 Lowest SLP: 28.98 Storm Total Rainfall: 3.43"
Satellite Beach - wind N 69G87mph
2SSE Patrick AFB - wind N 69G88mph
South Patrick Shores - wind N 73G90mph Lowest SLP: 28.86"
Cocoa Beach Park - wind N 60G77mph
Merritt Island (Sunset Lakes) - wind NW 36G55mph Lowest SLP: 28.90"
Merritt Island (Banana River) - wind NNW 63G81mph
3WNW Cape Canaveral - wind gust N 86mph
4NE Cape Canaveral - wind gust NNW 81mph Coastal Flooding
5NE Port Canaveral - wind gust N 100mph
KSC Tower 22 - wind gust NW 107mph (non-standard anemometer height)
KSC Tower 3 - NNW 77G107mph (non-standard anemometer height)
Titusville (Parrish Park) - wind N 58G75mph
5NNE New Smyrna Beach - wind gust N 80mph
Daytona Beach (Speedway) - wind gust NNW 91mph
5NE Lake Mary - 24 hour rainfall 7.04"
Orlando Intl Airport - wind W 30G61mph Lowest SLP: 29.30"
From the Melbourne NWS:
G. STORM IMPACTS BY COUNTY...
---------------------------------------------------------------------
COUNTY DEATHS INJURIES EVACUATIONS
DESCRIPTION
---------------------------------------------------------------------
BREVARD 0 1 UNKNOWN
ONE DIRECT INJURY. A MALE IN HIS 40S WAS INJURED IN PORT CANAVERAL
WHEN A SIGN FELL AND STRUCK HIM DURING THE STORM. DAMAGE TO
BUSINESSES AND HOMES MAINLY AS A RESULT OF FALLEN TREES. SEVERAL
HOMES WITH WATER INTRUSION DUE TO DAMAGED ROOFS. TWO HOMES LOST TO
FIRE AS OFFICIALS SUSPENDED EMERGENCY SERVICES DURING THE HEIGHT OF
THE STORM. SPORADIC COUNTYWIDE DAMAGE TO FENCES...AWNINGS...AND
SCREEN ROOMS. AN INITIAL COASTAL SURVEY INDICATES MODERATE TO MAJOR
BEACH EROSION WITH SIGNIFICANT DAMAGE TO BERMS AND DUNES.
PRELIMINARY DAMAGE ASSESSMENT INDICATES AN ECONOMIC LOSS OF $25
MILLION DUE TO COASTAL EROSION, AND $4 MILLION DUE TO VEGETATIVE
LOSSES. PROPERTY DAMAGE ASSESSMENT HAS NOT BEEN COMPLETED. ABOUT
300,000 CUSTOMERS WERE WITHOUT POWER AT THE HEIGHT OF THE STORM.
INDIAN RIVER 0 0 UNKNOWN
NO DEATHS OR INJURIES. ROUGH SURF AND MAJOR BEACH EROSION.
PRELIMINARY BEACH DAMAGE ASSESSMENT DETAILS MAJOR DUNE EROSION AND
SIGNIFICANT DAMAGE TO PEDESTRIAN CROSSWALKS WITHIN COUNTY OWNED
BEACH PARKS WITH AN ESTIMATED ECONOMIC LOSS OF $13 MILLION. SEVERAL
HOMES DAMAGED MAINLY BY FALLEN TREES.
LAKE 0 0 UNKNOWN
NO DEATHS OR INJURIES. MINOR URBAN...ROADWAY...AND LOWLAND FLOODING.
THE ST. JOHNS RIVER NEAR ASTOR PEAKED JUST BELOW MODERATE FLOOD
STAGE. MINOR DAMAGE TO FOUR HOMES WITH MAJOR DAMAGE TO THREE CAUSED
MAINLY BY FALLING BRANCHES AND TREES. EARLY PROPERTY DAMAGE
ASSESSMENT OF APPROXIMATELY $389 THOUSAND.
MARTIN 0 1 UNKNOWN
ONE INDIRECT INJURY. A 47-YEAR-OLD MALE WAS ELECTROCUTED WHEN HIS
TOOLS HIT A LIVE POWER LINE WHILE TRIMMING TREES IN STUART AFTER
THE STORM ON MONDAY OCTOBER 10 AROUND 8:15 AM. ROUGH SURF AND MINOR
BEACH EROSION. MINOR DAMAGE TO HOMES MAINLY AS A RESULT OF FALLEN
TREES. ISOLATED DAMAGE TO FENCES...AWNINGS...AND SCREEN ROOMS.
PROPERTY DAMAGE ASSESSMENT NOT YET AVAILABLE.
OKEECHOBEE 0 0 UNKNOWN
NO DEATHS OR INJURIES. MINOR ROOF DAMAGE TO ONE HOME. UP TO 2300
CUSTOMERS WITHOUT POWER AT HEIGHT OF STORM.
ORANGE 1 0 UNKNOWN
ONE DEATH INDIRECTLY RELATED TO HURRICANE MATTHEW. A 70-YEAR-OLD
WOMAN DIED AFTER HER MEDICAL DEVICE FAILED DURING A POWER OUTAGE.
PROPERTY DAMAGE ASSESSMENT NOT YET AVAILABLE FROM OFFICIALS.
OSCEOLA 0 0 UNKNOWN
NO DEATHS OR INJURIES. NO REPORTS OF STRUCTURAL DAMAGE OR FLOODING.
MINOR DAMAGE MAINLY TO TREES AND VEGETATION. UP TO 5900 CUSTOMERS
WERE WITHOUT POWER AT THE HEIGHT OF THE STORM.
SEMINOLE 0 0 UNKNOWN
NO DEATHS OR INJURIES. MINOR URBAN...ROADWAY...LOWLAND AND RIVER
FLOODING. DAMAGE TO BUSINESSES AND RESIDENCES MAINLY BY FALLING
BRANCHES AND TREES. INITIAL PROPERTY DAMAGE ESTIMATED $15 MILLION.
UP TO 70,000 CUSTOMERS WITHOUT POWER AT THE HEIGHT OF THE STORM.
ST. LUCIE 2 2 UNKNOWN
TWO INDIRECT DEATHS AND TWO INDIRECT INJURIES. A 58-YEAR-OLD INDIAN
RIVER ESTATES WOMAN DIED OF A HEART ATTACK AND A PORT ST. LUCIE MAN
IN HIS 80S DIED AFTER SUFFERING BREATHING PROBLEMS AND SYMPTOMS OF A
STROKE AS FIRE OFFICIALS SUSPENDED EMERGENCY SERVICES DURING THE
HURRICANE. A 90-YEAR-OLD MALE AND FEMALE WERE FOUND UNCONSCIOUS IN
THEIR PORT ST. LUCIE HOME AFTER OFFICIALS DISCOVERED THEY WERE
RUNNING A GAS GENERATOR IN THEIR GARAGE. ROUGH SURF AND MODERATE TO
MAJOR BEACH EROSION. DAMAGE CONFINED MAINLY TO TREES...POWER
LINES...AND SIGNAGE THROUGH THE COUNTY. PROPERTY DAMAGE ASSESSMENT
NOT YET AVAIALBLE FROM OFFICIALS.
VOLUSIA 4 0 UNKNOWN
ONE DIRECT AND THREE INDIRECT FATALITIES. A 63-YEAR-OLD WOMAN DIED
WHEN A TREE FELL ON HER AS SHE WAS OUT FEEDING ANIMALS AT HER DELAND
HOME. A 89-YEAR-OLD MAN FROM DELEON SPRINGS WAS ELECTROCUTED BY A
DOWNED POWER LINE MONDAY MORNING AROUND 8:00 AM OCTOBER 10. A 47-
YEAR-OLD NORTHEAST OHIO MAN ASSISTING CLEANUP EFFORTS IN ORMOND
BEACH WAS KILLED WHEN PART OF A DOWNED TREE ROLLED ON TOP OF HIM AND
PINNED HIM UNDERNEATH. A 9-YEAR-OLD DAYTONA BEACH BOY WAS FOUND
UNCONSCIOUS IN HIS HOME AFTER OFFICIALS DISCOVERED A GENERATOR
RUNNING IN ANOTHER ROOM. THE BOY LATER DIED AT HALIFAX HEATLH
MEDICAL CENTER. SIGNIFICANT DAMAGE TO HOMES AND BUSINESS THROUGHOUT
THE COUNTY WITH OVER 6400 PROPERTIES AFFECTED, 1100 WITH MINOR
DAMAGE, 300 WITH MAJOR DAMAGE, AND 40 STRUCTURES DESTROYED. INITIAL
PROPERTY DAMAGE ESTIMATE OF $490 MILLION. ROUGH SURF AND MAJOR BEACH
EROSION. BEACH EROSION DAMAGE ASSESSMENTS NOT AVAILABLE AT THIS TIME.
The CSU initial forecast for Atlantic basin tropical cyclone activity in 2015 has been released with the following lead-in comments: "We anticipate that the 2015 Atlantic basin hurricane season will be one of the least active seasons since the middle of the 20th century. It appears quite likely that an El Niño of at least moderate strength will develop this summer and fall. The tropical and subtropical Atlantic are also quite cool at present. We anticipate a below-average probability for major hurricanes making landfall along the United States coastline and in the Caribbean."
As of the end of February an El Nino is in place and it is expected to increase in strength with at least a moderate El Nino quite likely for the entire Atlantic hurricane season. Some of the forecast models including the ECMWF suggest that a strong El Nino event will occur. Since the end of November, 2014, SSTs in almost all of the Atlantic tropical basin have declined considerably with anomalies greater than -1.5C in some areas in the eastern Atlantic and the western Caribbean Sea. This significant shift downward in tropical Atlantic SSTs will produce another year of decreased activity in the basin and it also reduces the likelihood of any early season storms. The CSU forecast numbers are 7 tropical storms, with 3 of them becoming hurricanes with one hurricane becoming a major storm. This is one of the lowest CSU tropical cyclone forecasts that I have ever seen them issue. They also expected an ACE of 40 and a seasonal activity level at 45% of normal.
CSU lists 1991 as one of their analog years, however, with such a rapid decline in the overall Atlantic tropical SSTs, I believe that 1969 and 1991 are no longer valid analogs. My new analog years are:
1. 1977 - Atlantic activity was 6/5/1 ....... EASTPAC activity was 8/4/0
2. 1959 - Atlantic activity was 10/6/2 ...... EASTPAC activity was 15/5/3
3. 1953 - Atlantic activity was 13/6/4 ...... EASTPAC activity was 4/2/0
The updated averages for these analog years is 10/6/2 - which is close to my current forecast of 9/6/2. (updated on 4/15 to 8/5/1)
TSR also issued its updated forecast for the Atlantic basin and lowered their forecast totals to 11/5/2 with the following comments: "The TSR forecast has been reduced, since early December 2014, due to updated climate signals indicating that the tropical North Atlantic and Caribbean Sea in August-September 2015 will likely be cooler than normal and cooler than thought previously. Should the TSR forecast for 2015 verify it would mean that the ACE index total for 2013-2015 was easily the lowest 3-year total since 1992-1994 and it would imply that the active phase of Atlantic hurricane activity which began in 1995 has likely ended. However, it should be stressed that the precision of hurricane outlooks issued in April is low and that large uncertainties remain for the 2015 hurricane season."
As the season gets underway, keep an eye on the level of activity in the EASTPAC. If it starts to look like the Eastern Pacific is going to have a busy year, then 1953 can be discarded as an analog year for the Atlantic - which means that the upcoming Atlantic hurricane season could be mighty quiet - especially if the tropical Atlantic SST cooling trend continues into the Summer.
Remember that you can post your own forecast of seasonal numbers in the Storm Forum until the season starts on June 1st.
ED
It is beginning to look like the era of 'high spin cycle' tropical cyclone activity in the Atlantic basin that started in 1995 has run its course with only three named storms recorded through the end of August. There were hints of that demise last year with a below normal level of hurricane development, i.e., only two Cat I storms - the last time that the Atlantic only had two hurricanes in a season was 1982. The last time that a season had three or less named storms by August 31st was in 1994 - the last year of the previous 'quiet cycle' in the Atlantic.
In the 45 seasons from 1950-2014 there were 17 seasons that only had three named storms by August 31st, so its not an unusual event, but it is unusual that the last one was 20 years ago. At the other end of the activity spectrum, in 1995, 2005, 2011 and 2012 there were 12 named storms by August 31st. Here are the previous 16 seasons since 1950 with three or less named storms prior to September 1st along with activity totals for those years, totals for the following year, and hurricane landfall statistics for the 16 seasons:
Year - # by 8/31 - total activity - following year - U.S. landfalls - FL landfalls
1952 2 6/6/3 13/6/4 1 0
1956 3 8/4/2 7/3/2 1 1
1957 2 7/3/2 10/7/5 1 0
1961 1 11/8/7 5/3/1 2 0
1962 2 5/3/1 9/7/2 0 0
1963 2 9/7/2 12/6/6 1 0
1965 3 6/4/1 11/7/3 1 0
1967 1 8/6/1 8/4/0 1 0
1977 1 6/5/1 12/5/2 1 0
1980 3 11/9/2 12/7/3 1 0
1982 3 6/2/1 4/3/1 0 0
1983 2 4/3/1 13/5/1 1 0
1987 3 7/3/1 11/5/3 1 1
1991 2 8/4/2 7/4/1 1 0
1992 2 7/4/1 7/3/1 1 1
1994 3 7/3/0 19/11/5* 0 0
Average 2 7/5/2 9/5/2 1 0
(*1995 was not included in the 'following year' average since 1995 was the start of the active cycle.)
Note that although these were all slow starting years (and mostly quiet years), every season except 1994 had at least one major hurricane. Although these were mostly quiet years, only three of them did not have a U.S. landfalling hurricane, while in Florida only three seasons had a landfalling hurricane. In the following year, one season had normal activity while seven seasons were above normal and seven seasons had below normal named storm activity, i.e., no correlation to the previous year. On average, based on the 16 seasons that started with three named storms (or less) by August 31st, this season would be expected to have four more named storms - with a minimum of one more and a maximum of eight more.
Since the lack of activity cannot be blamed on an El Nino event (it has not yet started), it is increasingly likely that the period of Atlantic high tropical cyclone activity has ended. However, it is important to remember that the likelihood of a U.S. hurricane landfall is about the same (approximately 22%) during a 'quiet cycle' era as it is during an 'active cycle' era - and that is also true for a Florida hurricane landfall (about 5%).
ED
Kudos to The Weather Channel for deviating from the 'official' forecast earlier this afternoon. At 5PM EDT on July 3rd, NHC made an adjustment westward with the forecast track for Hurricane Arthur - and the actual track is probably going to be slightly west of that.
An upper level low located near 39N 58W at 03/21Z continues to retrograde westward. High pressure is centered south of the Great Lakes behind a cool front moving eastward through the Appalachian Range. Hurricane Arthur continues to maintain more of a north northeast movement and I would anticipate a track adjustment on a course a little more to the west with Arthur moving over eastern North Carolina just to the west of the Outer Banks as a Cat II Hurricane Thursday night into the early hours of Friday morning. As the front approaches the east coast, Arthur will be nudged into more of a northeast movement with the center passing just to the southeast of Cape Cod around midnight Friday night as a minimal Cat I hurricane undergoing extratropical transition.
Hurricane conditions likely over eastern North Carolina within 25 miles of the center track in the southwest and northwest quadrants and within 75 miles of the track in the northeast and southeast quadrants. Any hurricane preparations by those who are in or near the path of the hurricane should have already been completed. A fully transitioned strong Extratropical storm should pass over Nova Scotia on Saturday and over Newfoundland on Sunday.
ED
Its been a long time - over 8.5 years - since a hurricane made landfall in Florida. Have you checked your hurricane supplies lately? If you haven't, some items may need to be updated/replaced. Most folks (myself included) have a box of batteries in their personal home emergency kit, but its been so long since the last storm that the chances could be pretty good that those batteries may need to be replaced.
Have any canned or powdered foods exceeded their storage or use date?
If you have a generator, have you checked it out recently to see if it is still in good operating order? If you stored gasoline for that generator last year, its time to use it in a vehicle or other equipment and refill the gas containers with a supply of fresh gasoline.
If you put aside some medications/insulin etc., in a First Aid kit for use in an emergency when you might not be able to get to your doctor for a few days, are they still useable?
Do you still have a small analog battery-operated TV in your hurricane supply kit? If so, it will no longer work and you will need a digital TV replacement. There are some good ones on the market that will usually pick up a few stations with their built-in antenna.
If a hurricane reduces the IQ of your Smart Phone, do you have an alternate plan for getting in touch with co-workers, friends and relatives? A portable radio is valuable for getting storm updates, evacuation status changes and school and business closings/openings.
Don't forget to include the needs of your pets in your hurricane planning - especially if you need to evacuate when a storm threatens.
I have this uneasy feeling that this year someone in Florida is going to be thankful that they took the time to prepare for the storm.
ED
General Links
Resources
<strong>Satellite / Observations</strong>
Storm Forum (community discussion)
<strong>Data / Tracking / SST</strong>
<strong>Models</strong>
<strong>Other Commentary / Tools</strong>
<strong>Official / Primary</strong>
ICON,
Euro,

